Machine Learning Foundations
Day 1 | WISE Workshop — Addis Ababa 2026
2026-02-02
ML Foundations: Core Concepts
Learning Objectives
By the end of this session, you will be able to:
- Explain what machine learning is and how it differs from traditional statistics
- Distinguish between prediction tasks and causal inference
- Apply the bias-variance tradeoff to understand model complexity
- Describe how cross-validation prevents overfitting
- Connect ML concepts to supply chain forecasting
Why Machine Learning?
ML is Already Everywhere
Translation

Self-Driving Cars
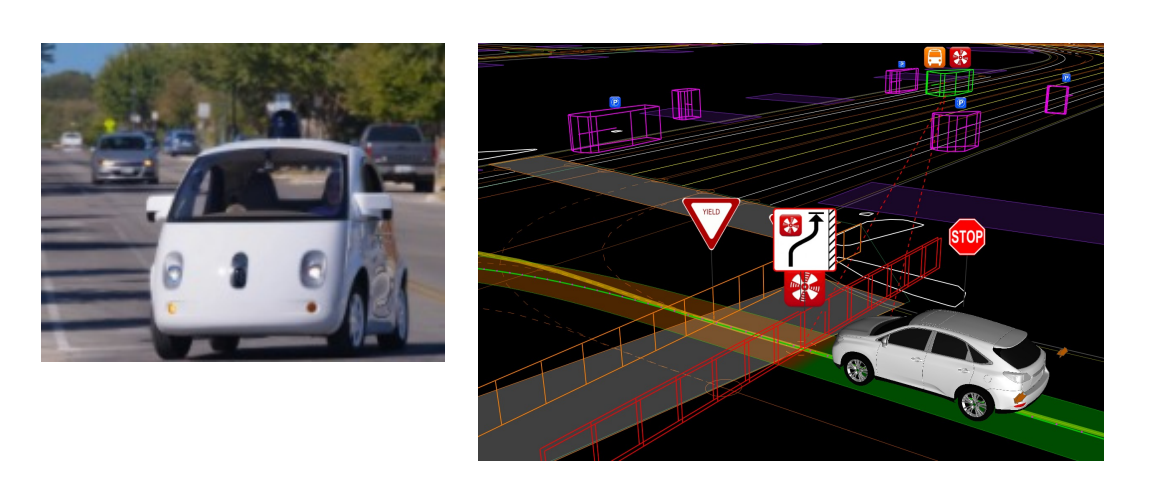
These advances share a common foundation: learning patterns from data to make predictions
The Key Insight
Traditional programming:
Rules + Data → AnswersMachine learning:
Data + Answers → Rules (learned patterns)ML discovers patterns from examples, rather than being explicitly told the rules
ML in Health & Supply Chains
| Application | What ML Predicts | Why It Matters |
|---|---|---|
| Demand Forecasting | Future medication needs | Better inventory planning |
| Stockout Risk | Which facilities will run out | Proactive intervention |
| Lead Time | Delivery delays | Buffer stock decisions |
| Disease Outbreak | Surge in demand | Emergency preparedness |
Tomorrow’s Day 2-4 workshops use ML predictions to inform simulation models
What is Supervised Learning?
Learning from Labeled Examples
Supervised learning = Learning a function \(f\) from labeled data \((X, Y)\)
The Setup
- Features (X): What we know
- Outcome (Y): What we want to predict
- Goal: Learn \(\hat{f}\) such that \(\hat{y} = \hat{f}(X)\) is accurate
Supply Chain Example
- X: Facility size, season, history
- Y: Next month’s demand
- Goal: Accurate demand forecast
The Cucumber Farm Story
A family farm in Japan wanted to automate cucumber sorting:
Old Approach
- Hand-coded rules
- “If color is X and shape is Y, then grade A”
- Brittle, hard to maintain
ML Approach
- Collect labeled photos
- Train model on examples
- Model learns the patterns
Key insight: We don’t program the rules—we let the algorithm discover them from data
Prediction vs. Causation
Two Different Goals
Traditional Statistics/Econometrics
Goal: Understand \(\hat{\beta}\) (coefficients)
- “Does X cause Y?”
- Hypothesis testing
- Causal interpretation
- β-hard problems
Machine Learning
Goal: Accurate \(\hat{y}\) (predictions)
- “What will Y be?”
- Minimize forecast error
- Out-of-sample performance
- Y-hard problems
Supply chain forecasting is Y-hard: We need accurate predictions, not causal effects
When Prediction is Enough
Many important problems only require good predictions:
| Domain | Prediction Task | No Causation Needed |
|---|---|---|
| Spam or not? | Just filter accurately | |
| Credit | Will they default? | Just rank risk |
| Poverty | Who is poor? | Just target resources |
| Supply Chain | How much demand? | Just stock appropriately |
For resource allocation and planning, prediction accuracy matters more than understanding why
The Poverty Targeting Example
Policy Problem: How do we identify poor households for cash transfers?
What We Have
- Observable characteristics
- Household size, assets, location
- Housing quality
- Partial income data
What We Need
- Accurate poverty prediction
- Rank families by need
- Direct resources efficiently
ML can predict consumption/income better than simple rules—enabling better targeting
The Bias-Variance Tradeoff
The Central Challenge: Overfitting
┌──────────────────┐  ┌──────────────────┐  ┌──────────────────┐
│   UNDERFITTING   │  │    JUST RIGHT    │  │   OVERFITTING    │
│                  │  │                  │  │                  │
│    ─────────     │  │      ~~~~        │  │    ~~/\~/\~~     │
│   •  •  •  •     │  │    •  • •  •     │  │   •  •  •  •     │
│                  │  │                  │  │                  │
│ Too simple       │  │ Balanced         │  │ Too complex      │
│ High bias        │  │ complexity       │  │ High variance    │
└──────────────────┘ └──────────────────┘ └──────────────────┘- Underfitting: Model too simple, misses real patterns
- Overfitting: Model too complex, memorizes noise
- Sweet spot: Captures signal, ignores noise
The Bias-Variance Tradeoff
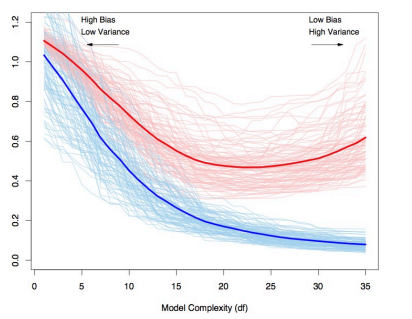
- Training error always decreases with complexity
- Test error eventually increases (overfitting!)
- Goal: Find the complexity that minimizes test error
The Polynomial Example
Consider predicting \(y\) from a single feature \(x\):
| Degree | Model | Risk |
|---|---|---|
| 1 | \(y = \beta_0 + \beta_1 x\) | Underfitting |
| 3 | \(y = \beta_0 + \beta_1 x + \beta_2 x^2 + \beta_3 x^3\) | May be right |
| 10 | \(y = \sum_{j=0}^{10} \beta_j x^j\) | Overfitting |
Hands-on preview: In today’s notebook, you’ll see this exact problem with a sine wave!
Why Overfitting is Dangerous
The model that fits training data best is NOT always the best predictor
What we optimize
Training error: How well we fit observed data
What we care about
Test error: How well we predict NEW data
An overfit model memorizes training data (including noise) and fails on new data
Cross-Validation
The Train/Test Split
┌────────────────────────────────────────────────────────┐
│                    All Data (100%)                      │
├────────────────────────────┬──────────────┬────────────┤
│     Training (60%)         │  Val (20%)   │ Test (20%) │
│                            │              │            │
│   Learn patterns           │ Tune model   │ Final eval │
└────────────────────────────┴──────────────┴────────────┘- Training: Learn patterns from data
- Validation: Compare models, tune complexity
- Test: Final, unbiased evaluation
Golden Rule: Never touch test data until the very end!
K-Fold Cross-Validation
More robust than a single train/validation split:
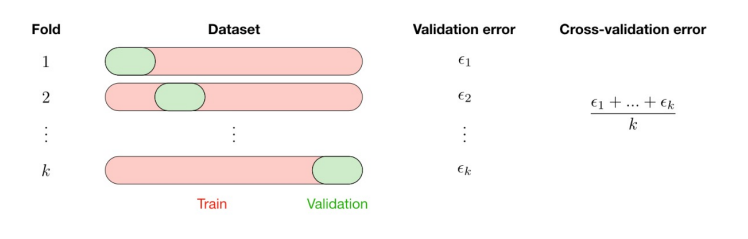
Process:
- Split training data into K folds
- Train on K-1 folds, validate on remaining fold
- Repeat K times, rotating the validation fold
- Average the results
Why Cross-Validation Works
Single Split
- Depends on random split
- Validation set may be “lucky”
- Unstable estimates
K-Fold CV
- Uses all data for validation
- Averages across multiple splits
- More reliable estimates
Rule of thumb: 5-fold or 10-fold CV is standard practice
Preview: Tomorrow’s Algorithms
Day 2: Regularization
Problem: What if we have many features (high dimensions)?
Solution: Add a penalty that shrinks coefficients
LASSO (L1)
- Shrinks coefficients
- Can set some to exactly zero
- Automatic feature selection
Ridge (L2)
- Shrinks coefficients
- Never exactly zero
- Keeps all features
Tomorrow morning: Deep dive into regularization with supply chain data
Day 2: Trees & Ensembles
Decision trees split data recursively:
                    [Month Demand < 500?]
                          /         \
                        Yes          No
                         |            |
              [Rainy Season?]    [Facility Size?]
                 /      \           /      \
               Yes      No       Small    Large
Ensembles combine many trees:
- Random Forest: Many independent trees, averaged
- Gradient Boosting: Trees that learn from each other’s mistakes
Tomorrow afternoon: Build and compare tree models
When is ML Appropriate?
ML Shines When…
Good for ML
- Prediction is the goal
- Large, complex datasets
- Non-linear patterns
- Many potential features
- Pattern discovery
Better for Traditional Methods
- Causal inference needed
- Small sample sizes
- Need interpretable coefficients
- Well-understood relationships
- Hypothesis testing
Connecting ML to This Workshop
Day 1: ML Foundations     →  Day 2: ML Algorithms & Practice
        (Today)                        (Tomorrow)
                                          │
                                          ▼
Day 3-4: ABM Simulation   ←   ML Predictions feed into
        (Wed-Thu)               agent-based models
Your ML forecasts become inputs to the supply chain simulations on Days 3-4
Key Takeaways
Summary
ML learns patterns from data rather than following programmed rules
Prediction ≠ causation: ML excels at “What will Y be?” not “Why?”
Bias-variance tradeoff: Too simple = underfit, too complex = overfit
Cross-validation prevents overfitting and gives honest error estimates
Tomorrow: LASSO (feature selection) and Trees (non-linear patterns)
This week: ML predictions → ABM simulations for supply chain decisions
Discussion Questions
Before we move to hands-on:
Can you think of a prediction problem in your work that doesn’t need causal interpretation?
What features might help predict medication demand at Ethiopian health facilities?
How would you know if your model is overfitting?
Next: Hands-on Setup
Let’s apply these concepts with a practical demonstration:
- Set up your computing environment
- Load the workshop data
- See overfitting in action with a sine wave example
WISE Workshop | Data Sciences for Modeling & HTA